Plot Graph Flash
Advertisement
Bytescout Graph Digitizer Scout v.1 24
Bytescout Graph Digitizer Scout is a handy and useful application that provides users with several functions. This program allows you to convert hard copy graphs, plots and charts. This efficient software enables you to digitize graphs, charts and plots ...
Advertisement
Instrumentation Graph Extension ActiveX Components
ActiveX Automation HMI Instrument Input Components including different kinds of 3D buttons, switches, knobs, sliders, switchsliders, switchknobs and others can be widely applied in many industry HMI applications and Simulation environments ...

Animated Chart v.2.2.1
Flash charts for your website - simply and quickly. Animated Chart is software for Flash charts making which enables you to create original animated charts and publish them to your website. Animated chart solves the problem of business visualization because ...
ZigZag
Features:
Supported graph types:
1. Y(x);
2. X(y);
3. graphs of tables;
4. R(a) - in polar coordinates;
5. X(t) and Y(t) - parametrical equations;
You can specify color, style and width of lines for each graph. You ...
FusionCharts
FusionCharts v3 helps you create animated and interactive Flash charts for web and desktop applications. It livens up your applications by converting monotonous data into exciting visuals. FusionCharts can be integrated with a myriad of web technologies ...
FusionCharts Free
FusionCharts Free is a flash charting component that can be used to render data-driven & animated charts for your web applications and presentations. It is a cross-browser and cross-platform solution that can be used with ASP.NET, ASP, PHP, JSP, ColdFusion, ...
Flow Pro v.2.1.0.1
Looking for a handy tool to help you plot water surface profiles, or calculate critical depth and slope?
Flow Pro saves you time and money by letting you compare multiple hydraulic design alternatives and exports the results to Word or Excel.
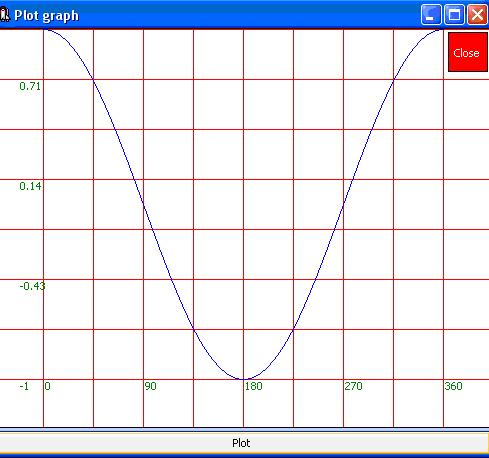
Mathwizard v.2.5
Plot graph :
>Can plot up to three graphs simultaneously.
>You enter the mathematics expressions in the same way you write it at school and university.It supports brackkets and nested brackets as well as trigonometric, exponential , and logarithmic ...
KaPiGraf v.1.7
After clicking OC?The create graphOCt, the graph is automatically drawn. This graph can be used in many ways: moving, zooming, changing parameters, exporting into MS Excel, printing, saving, transfering units and many others.
Instrumentation .Net Package
.NET Automation Components including line, shape, valve, pipe, drawing , 3D Components, Indicator, Gauge, ProgressBar, Ruler, Temperature Meter, LED/LCD, Counter and others can be widely applied in many industry HMI applications and Simulation environments ...
Dragonfly Chart .Net
.Net Window Form Chart Components including DAS_Net_PieChart, DAS_Net_FlatPieChart, DAS_Net_3DPieChart, DAS_Net_BarChart, DAS_Net_FlatBarChart, DAS_Net_XYChart and DAS_Net_AngularChart and others provide powerful chart functionalities which can meet demands ...
Graphic-Chart ActiveX Components
ActiveX Automation Components including Scope, Chart, Plotter, PieChart, BarChart, 3D Components, Indicator, Gauge, ProgressBar, Ruler, Temperature Control, AlphaNumeric LED, Counter and others can be widely applied in many industry HMI applications and ...
PlotPad v.1 2
PlotPad is a .net component that provides a visual control to visualize data in cartesian plots. Developers of WinForms applications can easily create xy-, yt- or scope-plots by simply feeding the component with their data. PlotPad has a lot of powerful ...
NumericTextBox v.1.0
PlotPad is a .net component that provides a visual control to visualize data in cartesian plots. Developers of WinForms applications can easily create xy-, yt- or scope-plots by simply feeding the component with their data. PlotPad has a lot of powerful ...