Data Plot Graph
Advertisement
Panoply v.3.1.4 Build C6U1
Panoply is an utility that enable user to plot raster image. Depending on the data, it can draw global longitude-latitude images or pole-to-pole latitude-vertical images.Panoply is a data visualization application, designed for the display of gridded ...
Advertisement
ANKHOR FlowSheet v.1.0.4.2768
Advanced Visual Data Processing Tool. ANKHOR FlowSheet is a universal tool for table based data analysis, processing and presentation that overcomes the weaknesses of traditional spreadsheet applications by a revolutionary visual approach. Combining The ...
WindRose PRO v.3.1.0
WindRose PRO is a software for plotting wind roses and other directional data. Data can be loaded as comma separated values (CSV) files or from Excel files. Plots can be saved in BMP format or exported in DXF format for CAD environments, as shapefiles ...
Igor Pro for Mac OS X 6.22A v.1.0
IGOR Pro is an interactive software environment for experimentation with scientific and engineering data and for the production of publication-quality graphs and page layouts. IGOR has been used by tens of thousands of technical professionals since its ...
Igor Pro 6.22A v.1.0
IGOR Pro is an interactive software environment for experimentation with scientific and engineering data and for the production of publication-quality graphs and page layouts. IGOR has been used by tens of thousands of technical professionals since its ...

ZENPLOT v.1.1.0.163
ZENPLOT, the data visualization software dedicated to advanced graphics
ZENPLOT allows you to create impactful visualizations by stacking different graphic layers (histograms, scatterplots, line charts, bar charts, heatmap / 2D surface, area chart, ...
GraphDiag v.1.00
The Library GraphDiag is intended for building graph and diagrams on HBITMAP, surface DirectDraw and in file BMP format. The Library can build the graphs on entered text line and diagrams, as from tables, which format is provided by developer, so and ...
Diatomic v.1.4.1.1
Diatomic is a spectral simulation software for diatomic molecules. It allows the user to simulate laser-induced fluorescence, absorption, and emission spectra of diatomic molecules. The software assumes the electric dipole selection rules.Diatomic Features:
1.
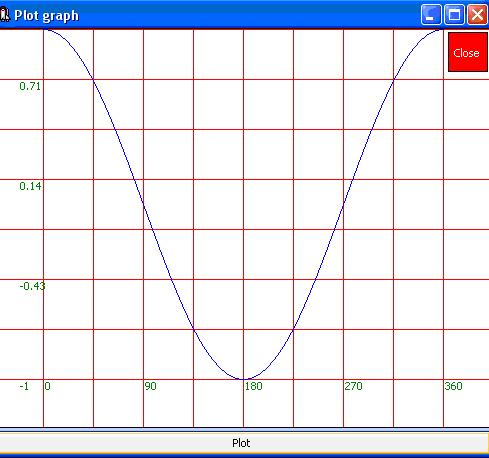
Mathwizard v.2.5
Plot graph :
>Can plot up to three graphs simultaneously.
>You enter the mathematics expressions in the same way you write it at school and university.It supports brackkets and nested brackets as well as trigonometric, exponential , and logarithmic ...

Ideal Weight v.1.6.0.0
6
Changes in look&feel
Insert data from past dates
v1.5 New features
-Save calculated data for different users
-To follow the evolution of the weight of each user
-Edit and Delete saved usernames
-You can ...
MathGL for Mac OS X & Linux v.2.1.2
* a library for making high-quality scientific graphics under Linux and Windows; * a library for the fast data plotting and handling of large data arrays; * a library for working in window and console modes and for easy embedding into other programs; ...
MathGL v.2.1.2
* a library for making high-quality scientific graphics under Linux and Windows; * a library for the fast data plotting and handling of large data arrays; * a library for working in window and console modes and for easy embedding into other programs; ...
GLE for Mac OS X v.4.2.2004
GLE supports various graph types (function plots, histograms, bar graphs, scatter plots, contour lines, color maps, surface plots, ...) through a simple but flexible set of graphing commands. More complex output can be created by relying on GLE's scripting ...
Instrumentation .Net Package
.NET Automation Components including line, shape, valve, pipe, drawing , 3D Components, Indicator, Gauge, ProgressBar, Ruler, Temperature Meter, LED/LCD, Counter and others can be widely applied in many industry HMI applications and Simulation environments ...