Technical Charts
Advertisement

Auto Technical Analysis Software v.1.0
This is the first ever technical software that provides support and resistance levels in digital form along with the strategies. This is very simple software to understand and operate. This is an extremely user-friendly readymade tool based on our vast ...
Advertisement
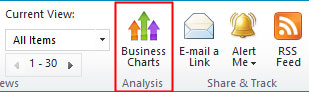
SharePoint Business Charts v.1.0.806.3
Business Charts provides an easy way for end users to create charts directly in SharePoint list without help from an IT administrator. End users just click the ribbon get started.
Multiple Chart Types Supported
5 chart types are provided in ...
Magic Charts v.2.7b2
Magic Charts is a tool to easily follow the stock market using Point and Figure charts. We send an updated copy of the sample portfolio everyday along with the updated charts. We have charts of US stocks, US mutual funds, ETFs iShares, Londen, Australian ...
MySQL Charts Generator v.1.0
Smart Chart Maker is far by the best solution to generating and managing an unlimited amount of dynamic charts that are fed directly from a MySQL database and situated around the tables and/or queries. One of the key features of Smart Chart Maker is that ...

AnyChart JS Charts and Dashboards v.8.7.0
AnyChart is a robust and superfast JavaScript charting library to add great-looking, interactive HTML5 charts into any project, in any browser, and on any platform/OS including mobile ones.
AnyChart provides advanced customization and flexibility ...

AnyGantt JS Gantt Charts v.8.7.0
AnyGantt JS Gantt Charts library is an advanced JavaScript-based data visualization solution, allowing everyone to utilize power of animation and ultimate interactivity. AnyGantt is perfect for building complex and informative HTML5 Gantt charts.
AnyGantt ...
ACCESS Wordlist English German Technical
Wordlist Technical Dictionary Database English German to integrate into your applications in ACCESS Format. The demoversion includes the letter "C" with 5910 Keywords. Fullversion English German Dictionary 51696 keywords with 51696 translations. Also ...
Excel Wordlist English German Technical
Wordlist Technical Dictionary Database English German to integrate into your applications in Excel Format. The demoversion includes the letter "C" with 5910 Keywords. Fullversion English German Dictionary 51696 keywords with 51696 translations. Also available ...
Excel Copy and Paste Multiple Charts Into MS Word Software
Copy multiple charts from MS Excel into a new or existing MS Word document. Excel 2000 or higher required. Word 2000 or higher required.
Excel Extract Data From Charts or Graph Software
Extract data from one or many charts in MS Excel. Save all extraction results as a text file. Excel 2000 or higher required.
SEE Technical v.5.0
SEE Technical is so easy to use that many clients finish their first project the same day they get the software. Symbol libraries, standard page formats, drawing tools... everything is just a mouse click away. Designed for those looking to increase productivity, ...
IDC - Imray Digital Charts v.1.0
Imray Digital Charts for the East Coast, North Sea and Channel Coasts were first published at the end of 2005. Their clear and simple format has come to be regarded as one that has set standards for entry level electronic charting, so that in 2007 the ...
US Mileage Charts v.2
US Mileage Charts and Tables in Excel format, including travel times and distances for both the fastest and shortest routes.
Includes sets of tables for every US State, and one large pan-US chart.
Total: 204 tables in 51 files. Over half a million ...
EZ-Files Technical Indicator Library v.v1
The EZ-Files Library contains 26 technical indicators pre-built in Excel Spreadsheet Format. These Excel files are tremendously useful for constructing securities trading, technical analysis, or statistical models in Excel. EZ-Files save you countless ...