Financial Graph Examples
Advertisement

C++ Builder Examples Collection v.5.0
What you will find here is a set of examples for most used methods and components in everyday programming. Save yourself hours of online research and going through tons of useless code.
In one place, you will have a set of examples ...
Advertisement

ESBFinCalc Pro - Financial Calculator v.1.1.1
ESBFinCalc Pro is a Financial Calculator that aims to provide a sophisticated yet easy to use tool to perform Financial Calculations including Simple Interest, Compound Interest, Investments, Loans, Annuities, Depreciation, Coupon Dates and other features.

Cppcliexamples collection of C++/CLI examples v.1.5
Collection of programming examples for C++/CLI with focus on WinForms development. Code samples for programmers who want to learn C++/CLI and use the source code as a framework. Real world examples with focus on WinForms.

AnyChart Stock and Financial Flash Chart v.1.1.0
The component has numerous advantages over similar software, which excel it as a unique stock and financial charting solution on the market. While working on its functionality, we strove to make it comfortable and easy, so that you could work out the ...

Financial Accounting Icons v.1.0
The Financial Accounting Icon Collection is a high quality icon collection containing over 3100 icons, all grouped up in one icon library. It is most definitely a valuable icon resource to any developer or software programmer or company looking to develop ...
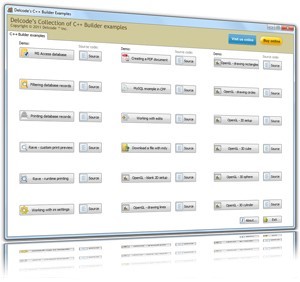
Delcode's C++ Builder examples v.4.5
Delcode's Collection of C++ Builder Examples. Code samples covering database, Rave reports, user gui, OpenGL examples and more. Full source code on purchase.
DRPU Financial Accounting v.1.0.1
DRPU Financial Accounting is a highly automated accounting program that manages and maintains financial accounting information in the easiest way. The billing and inventory management program maintains the sales and purchase details, income and expenses ...
GetData Graph Digitizer v.2 24
GetData Graph Digitizer is a program built for getting raw data out of visual graphs for analytical purposes. Most of the comparative data are usually visualized by graphs and charts. This software helps you in converting these visual data in to figures ...
Insta-Graph v.2.0
Insta-Graph is an add-in for Microsoft Excel that will revolutionize the way you create and use graphs (aka charts) in Excel. Anyone who has to analyze information, identify trends, prepare budgets, forecasts, or look at any other information in Excel ...
Bytescout Graph Digitizer Scout v.1 24
Bytescout Graph Digitizer Scout is a handy and useful application that provides users with several functions. This program allows you to convert hard copy graphs, plots and charts. This efficient software enables you to digitize graphs, charts and plots ...
Graph Paper Maker v.8.0
Graph Paper Maker is software that lets you create your own custom sheets of graph paper. You have complete control over the graph characteristics:
- X and Y axis can independently be set for linear or log scale, and scaling
- Selection ...
CoSBiLab Graph v.1.0
Graph constructs, visualizes and modifies graphs as well as calculates measures and layouts.
CoSBiLab Graph can construct, visualize and modify graphs as well as calculate measures and layouts. CoSBiLab Graph can import and export data in a ...
N Financial Reader v.2.11.805
N Financial Reader is an essential integrated financial tool. It is a tool that works vertically into specific stock analysis or tracking horizontally over different markets or investment related products, for e.g. forex (currencies), stocks, mutual funds, ...
3D Multi Series Line Graph v.2 1
This applet is designed to take multiple series of numerical data and display the information as a 3D Multi series Line Graph. The applet will automatically size itself to the available area given to it by the HTML form. (The WIDTH and HEIGHT of the APPLET ...